Monday, July 1, 2024

Supreme Court rules that Trump had partial immunity as president, but not for unofficial acts − 4 essential reads


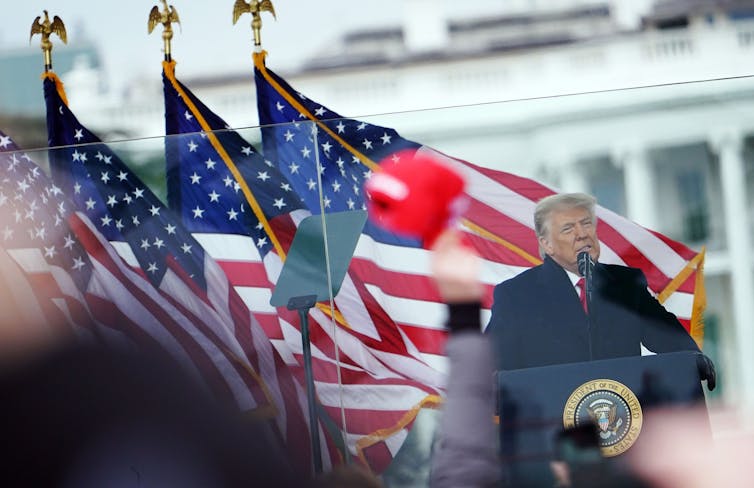
President Donald Trump speaks at a rally on Jan. 6, 2021, before the Capitol insurrection. Mande Ngan/AFP via Getty Images
Amy Lieberman, The Conversation; Jeff Inglis, The Conversation, and Naomi Schalit, The Conversation

The U.S. Supreme Court has ruled that a president, including former President Donald Trump, “may not be prosecuted for exercising his core constitutional powers, and he is entitled, at a minimum, to a presumptive immunity from prosecution for all his official acts.”

The decision is “super nuanced,” as a law scholar explained to The Conversation shortly after the decision was announced on July 1, 2024.

While a president has total immunity for exercising “core constitutional powers,” a sitting or former president also has “presumptive immunity” for all official acts. That immunity, wrote Chief Justice John Roberts in the majority opinion, “extends to the outer perimeter of the President’s official responsibilities, covering actions so long as they are not manifestly or palpably beyond his authority.”

“There is no immunity for unofficial acts,” the court ruled.

The vote was 6-3, as the court’s three liberal justices – Elena Kagan, Sonia Sotomayor and Ketanji Brown Jackson – strongly disagreed with the majority opinion in a dissent.

“Today’s decision to grant former Presidents criminal immunity reshapes the institution of the Presidency. It makes a mockery of the principle, foundational to our Constitution and system of Government, that no man is above the law,” Sotomayor wrote in the dissenting opinion.

The federal prosecution against Trump for his actions to overturn the 2020 presidential election will now go back to lower courts to determine which of the federal charges against Trump can proceed. One outcome, though, is clear – this decision will have a major impact on presidential power and the separation of powers in government.

Until all of the decision’s nuances are parsed by constitutional law scholars, here are four stories to help readers better understand the arguments leading up to the decision and what was at stake with this case.

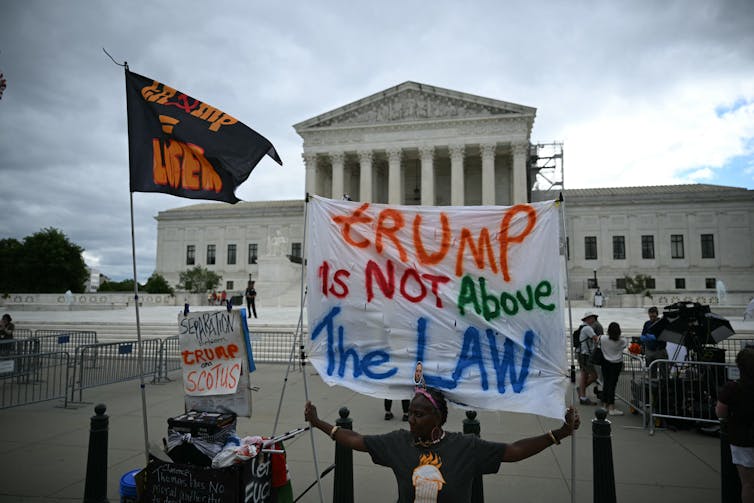
People stand outside the Supreme Court and hold signs, one of which that says, 'Trump is not above the law'
People protest outside the Supreme Court on July 1, 2024, ahead of the court’s anticipated decision on whether Donald Trump is immune from prosecution. Drew Angerer/AFP via Getty Images

1. Laying the groundwork

Trump claimed he is immune from federal prosecution for his efforts to overturn the 2020 presidential election because he was in office as president at the time.

Trump’s argument centered on a claim … that a president cannot be subjected to legal action for official conduct or actions taken as part of the job,” wrote Claire B. Wofford, a political science scholar at the College of Charleston.

Since 1982, in a case dating back to Richard Nixon’s presidency, presidents have been deemed immune from civil lawsuits based on their officials acts, Wofford explained, and Trump sought to expand that immunity protection. But it was a big ask, Wofford wrote:

“Protecting the president from the hassles of civil litigation is one thing; permitting the president, charged in Article 2 of the Constitution with faithful execution of the laws, to be able to break those same laws with impunity is quite another.”

Indeed, U.S. District Court Judge Tanya Chutkan wrote in December 2023 that Trump did not have the “divine right of kings to evade criminal accountability.” And a federal appeals court agreed in February 2024. That’s the ruling Trump appealed to the Supreme Court.

2. An inconsistent claim

Trump’s claim faced an uphill battle. Stefanie Lindquist, a scholar of constitutional law at Arizona State University, observed:

In several of the lawsuits he filed challenging election results in the wake of the 2020 election, Trump himself said he was acting ‘in his personal capacity as a candidate,’ as distinct from his official capacity as president.

"Now, though, Trump claims that whether or not he was acting as a candidate on Jan. 6, his comments on ‘matters of public concern’ fall within the scope of his presidential duties.”

That inconsistency, as well as the general principle in the Constitution that no person could be above the law, made Trump’s position a difficult one to argue.

3. A decision a long time coming

Wofford, a constitutional law scholar at the College of Charleston, observed before the Supreme Court’s July ruling that there was public concern about the time it took the court to reach a decision, but she said that delay was much more likely in service of democracy than it was a partisan play:

When the Supreme Court makes a decision, it is inevitably answering a very difficult legal question. If the answers were clear, the case never would have been the subject of high court litigation in the first place.”

And the task the justices have in deciding the case is vital to the nation, she wrote:

“(G)iven the potentially unconstitutional actions Trump has threatened to take if re-elected, the country will need a strong and well-respected Supreme Court in the very near future. Those angry with the court should actually be very glad it is working as usual here. If it weren’t, their fear that Trump will get away with it all may indeed be realized.”

Two men talking in a room behind a chandelier.
Donald Trump speaks after the appeals court hearing on his claim of immunity from prosecution on Jan. 9, 2024, in Washington. Jabin Botsford/The Washington Post via Getty Images

4. What this means for the future

Earlier this spring, Wofford noted some disturbing portents during the oral arguments before the Supreme Court on April 25, 2024:

Several of the justices, across the ideological spectrum, were very concerned about the practical implications of allowing a president to have immunity to some extent, or not allowing the president to have immunity.”

For instance, Wofford noted,

“Justice Samuel Alito seemed really concerned about the president being subject to political prosecution if he were not protected by immunity. … On the flip side … (Justice Ketanji Brown Jackson) said a president could enter office ‘knowing that there would be no potential penalty for committing crimes.’”

Wofford expected the justices would try to avoid granting either complete immunity or no immunity at all – and therefore allow Trump’s federal trial for attempting to overturn the 2020 presidential election to continue based on the fact that many of his actions were private, not official. Though that held peril, too, Wofford wrote:

“I wish there were a different vehicle through which the court could resolve this question and that it didn’t feel to so many people that the fate of our government, and the stability of our system, was on the line. … If it does not make a clear, resounding statement that the president is not above the law, then I think we have a serious problem.”

This story is a roundup of articles from The Conversation’s archives.The Conversation

Amy Lieberman, Politics + Society Editor, The Conversation; Jeff Inglis, Politics + Society Editor, The Conversation, and Naomi Schalit, Senior Editor, Politics + Democracy, The Conversation

This article is republished from The Conversation under a Creative Commons license. Read the original article.

Thursday, May 9, 2024

These U.S. cities have the best public transit (2024 study)

 Published on ConsumerAffairs.com

One factor people consider when looking for a new home is how easy it is to get around. Driving and walking are the most common modes of transportation, but prospective buyers and renters are also increasingly considering public transportation.

In 2018, only 30% of buyers said a new home’s proximity to public transit was “very important” or “extremely important,” according to the 2023 Zillow Consumer Housing Trends Report. But in 2023, 43% said so — the largest increase of any neighborhood characteristic. Thirty-seven percent of renters said living near public transportation was “very important” or “extremely important,” the highest level in the past six years. While many people may want to be close to public transit for career purposes, the benefits may extend beyond work.

“Living near public transportation is more important to today’s buyers and renters than it’s been in at least the past several years. Still, it’s likely not the deciding factor for many movers — more say living in a walkable neighborhood, living near leisure amenities and living near family are important to them,” Zillow senior economist Nicole Bachaud told ConsumerAffairs.

 “While the importance of living near public transportation has been on an upswing for homebuyers, the importance of commute times has stayed relatively steady. That could indicate buyers are interested in public transit for more than just their trips to the office and back.”

Knowing how you'll get around your new hometown is vital before hiring movers to take you there. To help, the ConsumerAffairs Research Team investigated and ranked the nation’s 50 largest cities to see which have the best public transit systems. The analysis is based on 2022 data from the U.S. Department of Transportation’s National Transit Database, and it takes into account how useful, safe, affordable and efficient transit services are in the nation’s top cities.


KEY INSIGHTS

Bigger isn’t always better. While the country’s most populous metro area, New York City, had the highest-scoring transit system, second place went to the much smaller San Francisco metro area. Only three of the top 10 transit systems are in the nation’s top 10 most populous cities.

Good transit spans the country. Among large cities, the top 20 for transit include locations on the Atlantic and Pacific Coasts, the South, the Mountain West, the Midwest and along the Great Lakes.


Transit is safe. The average rate of major safety events across the 50 largest U.S. cities’ transit systems is 3 per 1 million miles traveled by transit vehicles.


Transit is affordable. The average transit trip in the nation’s largest cities costs $2.56 one way, even when accounting for varying prices by distance, peak hours and monthly passes.


Top 10 cities with the best public transit

Some advantages of public transit systems include their eco-friendliness, shorter commute times and connectability. Transit vehicles emit far fewer greenhouse gases per passenger mile than a regular car, and you don’t have to fight traffic yourself or pay for parking at your destination. Transit lines also usually connect, making longer trips possible, such as weekend getaways.

Personal advantages abound, too. Riding on local public transit can allow you to see diverse neighborhoods and meet other people you share the city with. Relieved from driving, you can also rest, read or otherwise relax during the journey.

Artificial intelligence can also make public transit systems more efficient and save riders time by analyzing different routes and schedules to get you to your destination faster and without as much of a hassle.

A 2020 report from the International Association of Public Transport found AI offers the potential to adjust transit services in real time, responding to heavy traffic, heavy ridership and sudden emergencies. The report found that AI systems can also help users plan journeys that combine multiple stops and interconnecting services and adapt fares to meet specific goals for both revenue and equity. They can also save agencies money by optimizing fuel efficiency and maintenance services.

Since that report came out, the U.S. federal government has spent millions of dollars helping transit agencies around the country develop AI systems that aim to improve service, reliability and cost in transit systems. The starting point for many of the nation’s most populous cities is already quite good — but there is still much room for improvement everywhere.

Here’s how the cities stacked up:

1. New York, New York

  • Annual public transit trips per metro area resident: 144.2
  • Share of stations ADA-compliant: 51.4%
  • Safety score (combining fatalities and serious injuries): 13.07 out of 20
  • Average fare revenue per trip: $1.75

The nation’s most populous metro area is served by a large number of transit agencies, with trains and buses covering the five boroughs of New York City itself, as well as areas well into New Jersey, Connecticut and downstate New York. While the average fare revenue is higher than most, it’s still cheaper per trip than in Pittsburgh, Pennsylvania, and Buffalo, New York.

2. San Francisco, California

  • Annual public transit trips per metro area resident: 53.6
  • Share of stations ADA-compliant: 97%
  • Safety score (combining fatalities and serious injuries): 13.91 out of 20
  • Average fare revenue per one-way trip: $1.63

With the third-worst commuter traffic in the nation, San Francisco residents might be desperate for other ways to get around. Fortunately, Bay Area Rapid Transit connects the city with its suburbs, and the Muni bus and train system – including the city’s famous cable cars – gets people around the city itself. There are also free shuttles to get people to and from public parks.

3. Los Angeles, California

  • Annual public transit trips per metro area resident: 29
  • Share of stations ADA-compliant: 100%
  • Safety score (combining fatalities and serious injuries): 16.48 out of 20
  • Average fare revenue per one-way trip: 49 cents

Los Angeles, well known as a sprawling car-oriented metropolis, has a transit system that doesn’t get as much use per capita as other cities’ services. However, it’s one of the safest and most affordable transit systems nationwide.

4. Richmond, Virginia

  • Annual public transit trips per metro area resident: 8.5
  • Share of stations ADA-compliant: 100%
  • Safety score (combining fatalities and serious injuries): 18.27 out of 20
  • Average fare revenue per one-way trip: 24 cents

With free local bus fares across the city, including high-speed buses with some dedicated lanes that provide service every 10 minutes on weekdays and every 15 minutes on weekends, Richmond’s public transit system is safer and more efficient than many other large cities’ services. Unfortunately, it is used less frequently than any other system mentioned in our top 10 list.

5. San Diego, California

  • Annual public transit trips per metro area resident: 21
  • Share of stations ADA-compliant: 100%
  • Safety score (combining fatalities and serious injuries): 14.74 out of 20
  • Average fare revenue per one-way trip: $1.10

new safety initiative, expanded service and upcoming investments in new vehicles, including electric buses, are drawing riders to San Diego’s trolleys and buses, which serve the downtown area and the surrounding communities.

6. San Antonio, Texas

  • Annual public transit trips per metro area resident: 12.6
  • Share of stations ADA-compliant: 100%
  • Safety score (combining fatalities and serious injuries): 18.44 out of 20
  • Average fare revenue per one-way trip: 58 cents

San Antonio’s bus service spans the city and is set to expand in the coming years. The agency that runs it, VIA Metropolitan Transit, is also working to make its service schedules and maps more comprehensible to prospective users. The city is also considering new zoning rules that would make denser housing along high-capacity bus lines easier for developers to build.

7. Boston, Massachusetts

  • Annual public transit trips per metro area resident: 47.5
  • Share of stations ADA-compliant: 78%
  • Safety score (combining fatalities and serious injuries): 14.57 out of 20
  • Average fare revenue per one-way trip: $1.63

In Boston, a city well known for confounding even local drivers with one-way streets and hairpin turns, it’s tempting to let someone else handle navigation. Even with a relatively expensive average fare and incomplete ADA compliance at stations, the city’s MBTA trains and buses are relied on more heavily than transit vehicles in other large cities.

8. Seattle, Washington

  • Annual public transit trips per metro area resident: 36.7
  • Share of stations ADA-compliant: 99.1%
  • Safety score (combining fatalities and serious injuries): 14.52 out of 20
  • Average fare revenue per one-way trip: $1.57

Seattle’s public transit system, which includes buses, trains, and ferries, links its suburbs, downtown area and nearby islands. In 2024, the city is asking voters to raise their taxes to pay for a 20-year transportation plan that includes pothole repair and expanded transit services.

9. Washington, D.C.

  • Annual public transit trips per metro area resident: 36.7
  • Share of stations ADA-compliant: 100%
  • Safety score (combining fatalities and serious injuries): 15.41 out of 20
  • Average fare revenue per one-way trip: $1.29

The D.C. area’s roads are so famously congested that people joke there is no rush hour at all — except all the time. Fortunately, the Metro system encompasses trains, buses and subways run by city officials and state and local agencies in neighboring Maryland and Virginia.

10. Salt Lake City, Utah

  • Annual public transit trips per metro area resident: 26.7
  • Share of stations ADA-compliant: 100%
  • Safety score (combining fatalities and serious injuries): 11.83 out of 20
  • Average fare revenue per one-way trip: $1.07

Bus and rail lines crisscross the city and the surrounding county. The city’s plans for transit expansion call for additional services by 2030 and are being used to tempt Olympic officials to consider it as a location for the 2034 Winter Games.

U.S. public transit systems, ranked

In this study, we examined a range of data points from the U.S. Department of Transportation’s National Transit Database and calculated a score for each city, with a maximum number of 100 points achievable. You can read the full methodology below.


Why you should consider moving to a city with a good public transit system

When you’re looking for your next place to live — whether near where you already call home or somewhere farther afield — it’s worth noting how close transit services are and how well they’ll get you where you want to go.

According to Nicholas Julian, the senior program manager for land use at the National Association of Home Builders, builders and developers are noticing this interest. He observed that the move toward “transit-oriented development” has been decades in the making, with governments and private companies working to build housing along existing transit routes to reduce traffic and pollution. 

He noted that many cities are also rethinking minimum parking requirements to reflect residents’ desire to drive less and discourage additional cars from clogging the roads.

Although Julian works most directly with people involved in suburban development projects not designed explicitly around transit, he notes that “any type of access to public transit ...  will be advertised” to prospective buyers or renters.

He pointed out that some developers are stepping forward to reduce driving while improving people’s ability to get the services and experiences they want. For example, Culdesac Tempe, in Arizona, is a development that actively discourages residents from owning cars while providing free transit, reduced ride-sharing costs and free e-bikes to at least some residents.

“If you can build a car-free community in Tempe, it’s probably possible just about anywhere,” Julian said. That may also mean you can live a car-free or car-light lifestyle in just about any other city, too.

Methodology

The ConsumerAffairs Research Team conducted a comprehensive analysis of the public transit systems in the 50 most populous metropolitan areas across the United States and scored each on a point scale from zero to 100. To determine which cities had the best public transportation, we looked at the following metrics:

  • Usefulness to riders: We defined how useful a transit system was to its city’s residents based on three factors:
    • First, we calculated how many independent passenger trips the population took in 2022 in relation to the metro area’s population. This information was based on the National Transit Database annual metrics for 2022. (25 possible points)
    • Second, we calculated how far passengers traveled in 2022 per resident in the metro area. (20 possible points)
    • Third, we looked at how easy the main public transit system was to access for people with physical disabilities. We used the 2022 National Transit Database information on transit stations to calculate the percentage of all ADA-compliant systems. (10 possible points)
  • Safety: Based on the National Transit Database’s Safety & Security Major Event Time Series data for 2022, we calculated the number of major events, including collisions and derailments, per vehicle revenue mile in 2022. (10 possible points)
    • We also calculated the rate of fatalities and injuries in major events per 2022 vehicle revenue mile. (5 possible points each)
  • Affordability: We looked at the fare revenue per unlinked passenger trip based on the National Transit Database annual metrics for 2022. We compared that with the median household income in 2022 for that metro area according to the U.S. Census Bureau’s American Community Survey. (15 possible points)
  • Efficiency: We determined the average operating cost per passenger mile based on the National Transit Database annual metrics for 2022. (10 possible points)

ConsumerAffairs writers primarily rely on government data, industry experts and original research from other reputable publications to inform their work. Specific sources for this article include:

  1. U.S. Census Bureau, “Total Population.” Accessed April 30, 2024.
  2. U.S. Department of Transportation, “National Transit Database 2022 Metrics.” Accessed April 30, 2024.
  3. U.S. Department of Transportation, “National Transit Database 2022 Annual Database Transit Stations.” Accessed April 30, 2024.
  4. U.S. Department of Transportation, “National Transit Database Safety & Security Major Event Time Series.” Accessed April 30, 2024.
  5. U.S. Census Bureau, “American Community Survey.” Accessed April 30, 2024.

Wednesday, March 27, 2024

Rats, roaches, mold: The expensive cost of the most common—and feared—home infestations

red and green tent covering home being fumigated
Unwind // Shutterstock

Years ago, Kyle Selbach was visiting a home to talk to its owner about pest control services. "He had two roaches on the bill of his hat," recalled Selbach, director of operations at All "U" Need Pest Control in Fort Myers, Florida. "I was losing my mind." 

After continuing the conversation for a little while, Selbach finally interrupted and told the man what he was seeing. The man took off his hat, but then "he just flung the roaches off and put the hat right back on," said Selbach, still surprised all this time later.

But ignoring a pest problem won't make it go away — and might just make it worse.

The ConsumerAffairs Research Team sought to determine how common various pests are in American homes, and what people have done — and are willing to do — about them. The team analyzed data from the U.S. Census Bureau's American Housing Survey, collected every two years, from 2015 to 2021, and conducted a survey of a nationally representative sample of 2,000 people on related issues in February 2024. The survey found that, despite apathy and resistance from residents to spending money on home infestations, those who have dealt with pest issues have faced high expenses and unintended consequences. 

Homeowners fighting pests most often battled rodents and roaches

The survey found that an estimated one-third of people who spent money in the past year to fight pests in their homes spent more than $1,000. Infestations can also lead people to throw out damaged or soiled items, renovate their homes or, in extreme cases, move out of their homes entirely. Health issues are another risk — 16% of Americans report experiencing health issues as a result of pest infestations, ConsumerAffairs found.

Making matters worse, 17% of Americans say they have been judged by friends or family for having pests in their homes, according to the ConsumerAffairs survey.

Despite the potential for serious consequences, an estimated 12% of people say they would not be willing to spend any money to fight a pest infestation. And when faced with an actual problem, 17% of people say they take no action at all.

"Some people — believe it or not — literally don't care," Selbach said.

Harrowing experience

In general, the data shows that rats and mice are most common in U.S. homes, closely followed by cockroaches. Much less prevalent is mold, and even rarer are bedbugs. But bedbugs spark the most fear among residents, followed by rats, mold, cockroaches and mice, in that order.

Having pests in the home can be disruptive, embarrassing and unhealthy. Selbach said some treatment processes, such as fumigation, can be unpleasant for people to be around. Even when placing baits and traps around a home, he tells customers, "It's going to get worse before it gets better because we're stirring them up."  

According to the ConsumerAffairs survey, 12% of Americans have had to move out of their homes temporarily because of a pest issue, and another 7% said they had to leave their homes for good. About 14% reported needing renovations to get their infestation under control.

Cockroaches and rodents can trigger allergies and asthma, and they spread germs that contaminate food, said Changlu Wang, an extension entomologist at Rutgers University. Mice and rats can also carry fleas and mites that spread disease.

Ignoring the pests can make the problem worse, Wang said. Many of the people he has surveyed over the years have had infestations for long periods before they took action. And in many cases, neighbors' homes were the sources of the pests.

In a 2018-2019 survey of low-income apartment residents in New Jersey, Wang and his colleagues found that 56% of homes had at least one pest. He recommends that renters tell their landlords so they can take care of the problem — and that landlords who get resident complaints about pests check with all the neighbors in the building — to prevent the spread of an infestation.

Fighting back

Usually people try to fight pests on their own, Selbach said, and sometimes those measures work. "What's driving [the pests into the home] is the humidity change," he explained. "They're usually looking for more moisture than is available outside but also some nearby dry surfaces to inhabit, and gravitate to rooms with heavy water usage." 

That lines up with the ConsumerAffairs survey, which found that about two-thirds of residents with mold problems find these fungal infestations in their kitchens or bathrooms. 

Once they're in the home, pests can find plenty of food that is easier to access than in outdoor settings, Selbach said, noting that even the cleanest homes have some crumbs on the floor. That's why the pests stick around.

People try different ways to get rid of the problem: 57% of those surveyed by ConsumerAffairs reported trying store-bought pest control products, and 30% tried various home remedies, which Selbach says can even include essential oils. 

By the time someone calls in an expert, Selbach said, they have likely tried a range of unsuccessful approaches. "Typically they're calling when they've thrown in the towel," he said.

People most often turn to pest control products to control infestations

Wang said many of the sprays, bombs and ultrasonic repellers that are on the market don't actually work. He recommended people check with experts about what works, such as gel-based cockroach baits and standard snap traps for mice and rats. Wang himself uses snap traps to control the mice that periodically try to get into his garage and shed. They are cheap and reusable, he said, as long as you wear protective gloves while handling the traps.

Then again, according to the ConsumerAffairs survey, 17% of Americans say they take no action about the pests in their homes.

Wang said there are two reasons people might not act: "Either they financially cannot afford it, or they have lived with that environment from a young age, so they are less concerned about the presence of pests." 

It gets expensive

Pests can be costly — a lot more costly than people may hope. 

About two-thirds of the residents who have fought pests in their home in the past year paid up to $1,000 to address the problem. And another 30% spent between $1,001 and $5,000. 

Yet the ConsumerAffairs survey found 12% of people wouldn't be willing to spend anything to address a rat or mouse infestation, while 14% said the same for cockroaches and 12% said the same about mold.

"People are willing to spend on emotion," Selbach said. Once they're desperate, they'll have the mindset of 'I'll spend whatever to get rid of it,'" he said. 

Preventive measures can save you money—and headaches—in the long run

Selbach emphasizes, though, that preventive treatment is less expensive than removing an infestation. Many people first call to get rid of a problem and then sign up for periodic services to make sure it doesn't return.

He estimated that having an expert take care of roaches can cost $500, and rats about $1,000. Once the problem is gone — or if a homeowner is taking steps in advance of identifying a problem — an initial maintenance visit costs around $200, with quarterly visits costing another $120 or so, he said.

Wang said he has found people often go to extremes when it comes to pests, but not always for the best. 

"There are two extremes," he said. "One is they don't do anything and let the pests prosper. The other extreme is people get overprotective and use too many chemicals. Then you either waste money or contaminate the environment."

This story was produced by ConsumerAffairs and reviewed and distributed by Stacker Media.
Monday, March 4, 2024

Supreme Court says only Congress can bar a candidate, like Trump, from the presidency for insurrection − 3 essential reads

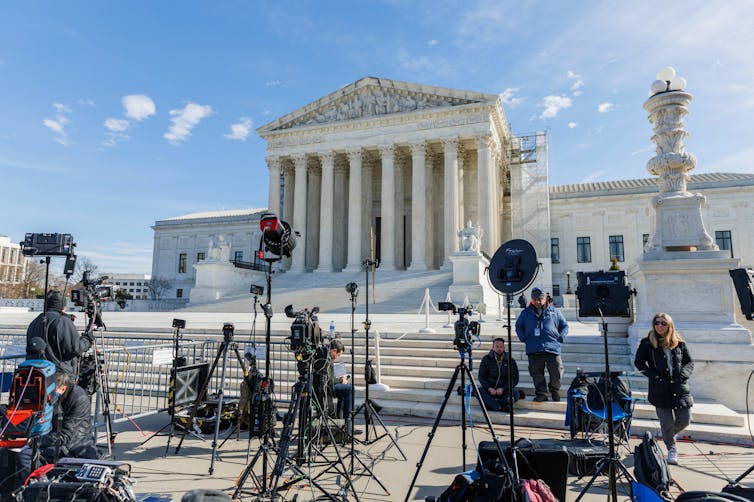
Journalists set up in front of the U.S. Supreme Court building on Feb. 8, 2024. Aaron Schwartz/Xinhua via Getty Images
Jeff Inglis, The Conversation

The U.S. Supreme Court has ruled, in a unanimous decision, that the state of Colorado cannot bar former President Donald Trump from appearing on Colorado’s presidential ballot under the provisions of Section 3 of the 14th Amendment to the U.S. Constitution.

The text of Section 3 of the 14th Amendment states, in full:

“No person shall be a Senator or Representative in Congress, or elector of President and Vice-President, or hold any office, civil or military, under the United States, or under any State, who, having previously taken an oath, as a member of Congress, or as an officer of the United States, or as a member of any State legislature, or as an executive or judicial officer of any State, to support the Constitution of the United States, shall have engaged in insurrection or rebellion against the same, or given aid or comfort to the enemies thereof. But Congress may by a vote of two-thirds of each House, remove such disability.”

The ruling said states may decide who is eligible to hold state offices, but only Congress may decide who is eligible to hold federal offices.

Writing for The Conversation U.S. as far back as 2021, several scholars have explained aspects of this part of the Constitution, how it was intended, and the legal and political considerations surrounding its function. They give context to the court’s ruling and what it means for the country now.

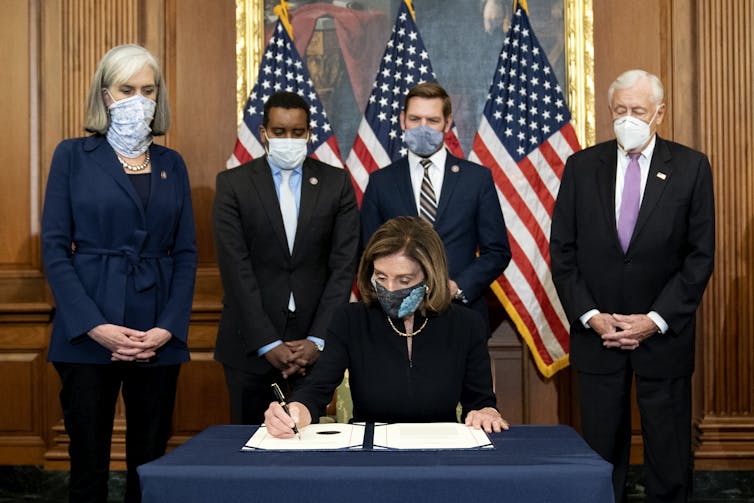
Pelosi signs a document with four people standing behind her, and American flags
Then-Speaker of the House Nancy Pelosi signs an article of impeachment against then-President Donald Trump on Jan. 13, 2021. Stefani Reynolds/Getty Images

1. A relatively recent development

In early 2021, Gerard Magliocca, a law professor at Indiana University, pointed out that up until that time, “Section 3 of the 14th Amendment was an obscure part of the U.S. Constitution.”

But this provision had an important purpose, he wrote:

“It prohibits current or former military officers, along with many current and former federal and state public officials, from serving in a variety of government offices if they ‘shall have engaged in insurrection or rebellion’ against the United States Constitution.”

The Supreme Court’s ruling did not decide whether Trump had or had not engaged in insurrection.

2. Justices focused on potential for national disarray

During oral arguments on Feb. 8, 2024, several members of the Supreme Court focused on the fact that this case was about a Colorado decision to bar Trump from the ballot, which suggested that other states might come to their own conclusions if the court didn’t deliver a clear message that would apply nationwide.

As Notre Dame election law scholar Derek Muller observed:

States are the ones who have the primary responsibility of running presidential elections. And Colorado was leaning very heavily into this authority they have over which candidates to list on the ballot and how that can vary from state to state. The pushback from the Supreme Court in this case was to say, in essence, you’re not dealing with local or state interests, you’re not dealing with these state-specific procedures for how you list candidates on the ballot. You are interpreting a provision of the U.S. Constitution, and then you are applying it in your own state in a way that could affect what happens in other states.”

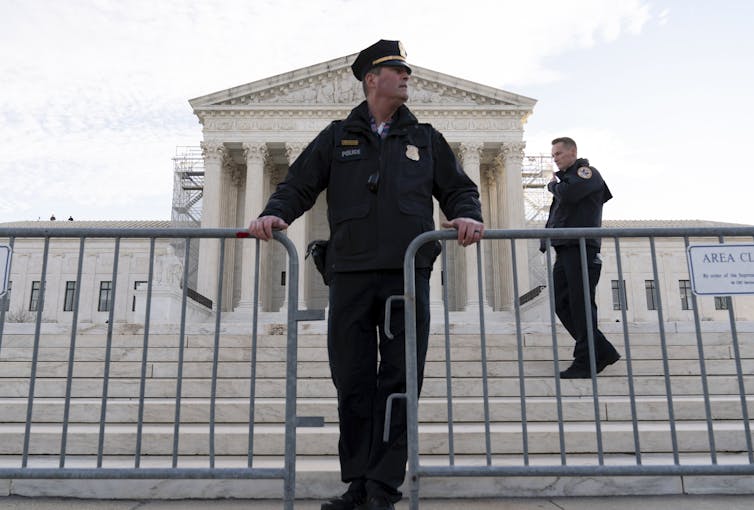
A police officer standing behind a barricade and in front of a large, white columned building.
Police place a fence at the U.S. Supreme Court on Feb. 8, 2024, before justices heard arguments over whether Donald Trump is ineligible for the 2024 ballot. AP Photo/Jose Luis Magana

3. The importance of consensus

The court appears to have taken pains to get to a unanimous decision. Muller anticipated such a move. He said it was likely because of the potential effect on elections:

This is a binary choice that either empowers the Republican candidate or prevents voters from choosing him. So when you have a choice in such stark, political and partisan terms, whatever the Supreme Court is doing is often going to be viewed through that lens by many voters. … (T)here will be as much effort as possible internally on the court to reach a consensus view to avoid that appearance of partisanship on the court, that appearance of division on the court. If there’s consensus, it’s harder for the public to … point the finger at one side or another.”

This story is a roundup of articles from The Conversation’s archives.The Conversation

Jeff Inglis, Politics + Society Editor, The Conversation

This article is republished from The Conversation under a Creative Commons license. Read the original article.

Thursday, February 22, 2024

The best states for going solar in 2024

housing development with solar panels in Muller
RoschetzkylstockPhoto // Canva

The best states for going solar in 2024

This year began with major wake-up calls about the environment: extreme cold weather linked to climate change, winter weather advisories in every single state, and nearly half of Americans at risk of dangerous cold and wind — all within the first two weeks.

More Americans are looking for ways to reduce their climate impact. Installing rooftop solar panels is one way to cut dependence on fossil fuels, which are burned to generate more than 60% of the country's electricity.

There are financial benefits, too: In every state, homeowners can potentially generate significant proportions of their electricity from a rooftop solar system. It does depend in part on the property itself, such as which way the roof is aligned or how much tree cover it has. Of course, it also depends on how much sun the area gets. And how much of a financial return you can expect will be influenced by the state's retail electricity market and local solar initiatives.

The ConsumerAffairs Research Team analyzed data from the National Renewable Energy Laboratory, Energy Information Administration, and the Database of State Incentives for Renewables & Efficiency, along with other sources, to determine which states are the best for solar energy. A breakdown of all the solar data for each state can be found below, as well as a full methodology for more details on how we calculated each state's Solar Score.


Key insights

  • Hawaii tops our list of the best states to go solar, thanks to high retail electricity prices.
  • While Indiana, Kentucky, Arkansas, Tennessee, and Alabama rank at the bottom of our list, federal solar incentives may still make it worthwhile for homeowners in these states to go solar.
  • Arizona, New Mexico, and California have the highest potential for solar energy of all states, meaning solar energy falls more intensely on those states than elsewhere.
  • Half of all states, plus Washington D.C., have no statewide programs that help homeowners afford rooftop solar installations.

Top five best states for going solar

Various factors help determine whether a state is a good place for homeowners to go solar with rooftop panels. Low installation costs and high retail energy prices can drive people to look for alternatives, and residents in states with more peak sunlight hours can produce more power with fewer panels. State laws and regulations can encourage people to go solar or discourage them.

We evaluated data in each of these categories and assigned points based on their relative importance to come up with each state's Solar Score. Along with the 50 states, we included Washington D.C., in our rankings.

1. Hawaii — Solar Score: 75.14 out of 100

High retail electricity prices are a key reason Hawaii is such a good place for people to install solar panels on their roofs. The potential savings are so clear that they more than make up for the state's limits on net metering eligibility and relatively low compensation rates for excess power generation. Through a program pairing rooftop solar with grid-connected batteries in customers' homes, Hawaii was able to shut down its last coal-fired power plant and replace the energy with solar power.

Hawaii has the nation's highest rate of existing rooftop solar capacity — far above that of California, which comes second in that category. The quick adoption rate has kept installation costs low — the 14th-lowest in the nation.

2. Nevada — Solar Score: 56.87 out of 100

Nevada is a pro-solar state in terms of both regulations and economics. As far back as 1997, the state allowed net metering for rooftop solar customers, but it dramatically cut back its payment rates and raised participation fees in 2015.

That didn't last long, though: In 2017, Nevada reinstated net metering under largely similar terms as before the 2015 changes. That long-term sustained support for solar energy has led to the state having more solar jobs per capita than any other.

The state is boosting rooftop solar in other ways, too. Consumer protection officials in Nevada are taking steps to protect customers who purchase residential rooftop solar systems against unscrupulous sales pitches, and a statewide nonprofit has applied for up to $250 million in federal Solar For All funding.

3. Delaware — Solar Score: 54.94 out of 100

Delaware has relatively low installation costs, reasonably competitive solar potential, and solar-friendly policies, including net metering and power purchase agreements. Its policies are also solar-friendly: In 2021, the state made it easier for people to support community solar projects. And in 2022, the state government launched a two-year program to give free solar panels to low-income homeowners.

But a major obstacle is in the technical details. One electric utility, the Delaware Electric Cooperative, which serves 20% of the state's residential customers, has blocked new rooftop solar installations from being connected to the electricity grid in large swaths of the state, saying its equipment can't handle any more incoming energy.

4. Arizona — Solar Score: 54.56 out of 100

Arizona has the highest average solar potential of any state and relatively low rooftop solar installation costs. It also has generally solar-friendly policies and a personal tax exemption to help defray the costs of installing rooftop solar systems. Along with legalized power purchase agreements, those circumstances have all helped make Arizona the state with the third-most rooftop solar capacity per capita in the country.

But some clouds may be on the horizon. In October 2023, the state's utility regulator, the Arizona Corporation Commission, reconsidered the rules under which homeowners are compensated for the excess electricity their solar panels generate. That's despite the fact that citizens, solar-industry companies, and even two of the three largest electric utilities in the state have supported keeping the existing rules in place. The process has not yet been completed.

5. California — Solar Score: 53.76 out of 100

California has relatively high retail electricity prices and great solar potential. Its rooftop solar rebate program has also been a factor in making California the state with the second-most rooftop solar installed per capita. The state has rules that prevent local or private restrictions on installing solar panels, as well as rules that protect homes from being shaded by neighbors.

But as with Arizona, the situation is shifting. New rules on how much credit homeowners can get for electricity produced on their roofs took effect in April 2023. Those changes have dramatically reduced the attractiveness of rooftop solar systems for homeowners and residents of multifamily and apartment dwellings. The solar installation industry projects that the current drop-off in installation numbers will continue. And in early January 2024, Gov. Gavin Newsom proposed cutting climate-related funding, including incentives for rooftop solar installations.

The five worst states for going solar

The places where going solar can be most challenging for homeowners are states that tend to have relatively low electricity costs and few existing installations. The states at the bottom of the list either ban or do not have clear rules about power purchase agreements, which can help homeowners reduce or even eliminate the cost of installing solar panels.

Going solar in these states can still be worth the money and effort — and can certainly have a positive impact on the environment — but homeowners may find themselves in an uphill battle as they make the switch to rooftop solar.

1. Indiana — Solar Score: 15.88 out of 100

Indiana has the highest rooftop solar installation costs, and its lack of statewide rebates to help offset those costs makes the economics of going solar less attractive in Indiana than any other state. Solar advocates call July 1, 2022, "the day Indiana rooftop solar died" because that's when the state's net metering policy expired. It was replaced by a system in which homeowners were paid much less for the excess power their rooftop panels produced. Solar installations in the state are down 67% since then, advocates say.

In late 2023, Indiana's electric utilities asked for a steep hike in residential electricity rates. Though regulators reduced the size of that increase, Hoosiers are still on track to see higher power bills in 2024.

2. Kentucky — Solar Score: 18.97 out of 100

The state government and several large cities in Kentucky see the opportunity for rooftop solar: They are all looking for funds from the federal Solar For All program. And in July 2023, a utility-scale rooftop solar array began operating on the roof of an Amazon warehouse at the Cincinnati/Northern Kentucky International Airport.

But Kentucky has no statewide programs to help residents pay the up-front costs of installing rooftop solar systems. It also bans power purchase agreements, which can be another way to cover those expenses.

3. Arkansas — Solar Score: 21.48 out of 100

With comparatively low residential electricity prices, no statewide aid to help cover installation costs and a ban on power purchase agreements, Arkansas's economic circumstances aren't positioned for residents to take advantage of the state's strong solar potential.

And conditions aren't getting better: Arkansas lawmakers in 2023 reduced the rate at which homeowners with rooftop solar panels will be compensated for the additional electricity their systems generate.

4. Tennessee — Solar Score: 23.33 out of 100

Tennesseans have some of the lowest electricity prices in the nation, which is no doubt part of the reason so few of them have rooftop solar systems installed already. With no state rebates or other programs and a low reimbursement rate for excess power generation, there are more barriers than opportunities for homeowners to put solar systems on their roofs.

There is some bright news: Under a new program negotiated with the Tennessee Valley Authority, some Nashville residents will become newly eligible to get credit for excess electricity generated from rooftop solar systems.

5. Alabama — Solar Score: 23.43 out of 100

Alabama's per-capita installed capacity of rooftop solar is the lowest in the nation, according to the Energy Information Administration data analyzed in this report. Part of that is no doubt due to high rooftop solar installation costs. Government policies aren't helping: The state outlaws power purchase agreements, does not protect properties from neighbors' shade, allows homeowners associations to ban solar panels, and only allows excess power to be purchased at wholesale rates, rather than at retail prices.

But it seems state officials and energy companies are interested in taking advantage of the state's high solar potential: They are exploring opportunities for large-scale solar projects.

See how your state stacks up

A breakdown of the factors used to calculate each state's Solar Score can be found here, showing how each state compares with others on residential electricity price, solar installation costs, solar potential and solar-friendly policies.

Going solar can be a good investment in any state. There's enough sunlight coming down everywhere in the U.S. to make rooftop-generated electricity cheaper, more reliable, and more climate-friendly than getting electricity from the grid. But navigating the maze of changing solar policies, incentives and costs can be complicated.

One particularly thorny solar policy, net metering, is being phased out in some states under pressure from utility companies that don't want to pay homeowners for the excess electricity they generate on their rooftops.

"As states develop successors to net metering, it's getting increasingly complicated," said Brian Lips, who manages the Database of State Incentives for Renewables & Efficiency. State incentives for rooftop solar typically get lower and less available over time, he observed.

Federal incentives can also help encourage the switch to solar rooftops, but they, too, are changing quickly. Homeowners who install rooftop solar systems between now and the end of 2032 can claim a federal income tax credit of 30% of the system's cost. And recent federal laws have allocated $7 billion in funding for the Solar For All program to help pay for residential solar installs in disadvantaged communities. The funds will be distributed starting in late 2024.

Installing solar panels is a common way for homeowners to generate clean energy, but it isn't the only way. Some people buy solar-only electricity, or solar power along with a combination of other renewable sources through their existing power companies, third-party electricity providers or community solar projects.

The bottom line is this: There are lots of ways and plenty of reasons to go solar, but staying updated on the most recent solar regulations, policies and incentives can help you make the most of your green energy transition.

Methodology

The ranking incorporates data on state electricity prices, installation costs, potential solar energy, existing solar capacity, and solar policies.

However, ConsmerAffairs did not factor in the cost of buying and installing a solar storage battery, which is a common add-on that allows residents to store extra energy the panels generate for use at night or during power outages.

Each state's Solar Score could reach a maximum of 100 points, with points assigned by the categories below.

Retail prices of residential electricity: 0 to 25 points
States' average retail prices of residential electricity for October 2023, according to the Energy Information Administration, were scored based on how close they were to the highest state's price. High retail electricity prices encourage people to seek other sources of energy.

Per-watt installation costs: 0 to 20 points
States' average per-watt installation costs for residential rooftop solar, according to SolarReviews.com and EnergySage.com, were scored based on how close they were to the lowest state's price. Low installation costs reduce a barrier to installing rooftop solar. The data was collected by ConsumerAffairs in January 2024.

Potential solar energy: 0 to 10 points
States' average potential solar energy capture in kilowatt-hours per square meter per day were calculated based on annual average Global Horizontal Irradiance data from the National Renewable Energy Laboratory Solar potential as of 2018, averaged across each state's area according to the U.S. Census Bureau's Topologically Integrated Geographic Encoding and Referencing system. States' averages were scored based on how close they were to the highest state's average. Higher potential solar energy makes more energy available to capture from a given rooftop area. (In Alaska, NREL only measures solar potential in the southernmost parts of the state.)

Existing residential solar capacity: 0 to 5 points
States' existing residential solar capacity per capita was calculated based on the Energy Information Administration's October 2023 estimates, except in Alabama, where the most recently available data was from the EIA's 2022 data for December 2022 — and on the U.S. Census Bureau's 2023 population data for each state. States were scored based on how close they were to the highest state's per-capita installed capacity. This information indicates where consumers have found policies, market forces, and other factors favorable for rooftop solar in the past.

Financial programs: 0 to 15 points
States' rebates, grants, loans, tax credits, and deductions were determined from the Database of State Incentives for Renewables & Efficiency (DSIRE) maintained by the North Carolina Clean Energy Technology Center. States got 3 points for each type of program, of which there were five. (A sixth type mentioned by DSIRE, a personal tax exemption, is not in place in any state.) These programs reduce the upfront cost of installing rooftop solar systems. DSIRE data was updated in November and December 2023.

Residential power purchase agreements: -10 to 10 points
States' laws and rules on residential power purchase agreements were determined from DSIRE data from November 2023. States got 10 points for allowing them and lost 10 points for banning them. States whose policies DSIRE had not identified or evaluated were given 0 points. These agreements can reduce or eliminate homeowners' up-front costs of installing rooftop solar systems.

Net metering: 0 to 10 points
States' laws and rules on net metering were determined from DSIRE data from November 2023. States with no rules got 0 points. States that required at least some utilities to use net metering got 10 points. States that required at least some utilities to use other methods to compensate customers for the energy their panels produced got 3 points. States whose regulations are in transition between net metering and other compensation got 7 points. These rules affect the amounts by which ongoing energy production can reduce homeowners' electricity bills.

Excess power payment rates: 0 to 3 points
States' laws and rules on excess power payment rates were determined from DSIRE data from November 2023. States that guaranteed payment at retail rates got 3 points. States that guaranteed payment at wholesale rates got 1 point. States that had a rate between retail and wholesale got 2 points. States that had no guaranteed rate got 0 points. These rules affect the amounts by which ongoing energy production can reduce homeowners' electricity bills or earn them additional money.

Solar access and solar easements: 0 to 2 points
States' laws on solar access and solar easements were determined from DSIRE data from November 2023. States that prevent local or private restrictions on installations of solar panels — called solar access laws — got 1 point. States that allow homeowners to seek protections of their property from being shaded by neighboring property — called solar easements — got 1 point. States that have both provisions got 2 points. States with neither got 0 points 

This story was produced by ConsumerAffairs and reviewed and distributed by Stacker Media.