Wednesday, November 6, 2024

Now the Electoral College votes for president – 4 essential reads

Jeff Inglis, The Conversation

The voters have cast their ballots, and after those ballots have been counted, and a winner has been projected by news organizations, that’s not the conclusion of the election. The actual outcome of the 2024 presidential election will be determined by the Electoral College.

The Conversation U.S. has had several articles explaining the history and effects of the United States’ curious method of choosing a president, not with one national election but with 51 smaller elections, in each state and Washington, D.C. Here are the highlights of that coverage.

1. A safeguard for democracy

The Electoral College was the result of a compromise devised among 11 men at the Constitutional Convention in the hot Philadelphia summer of 1787. It was meant as a protective measure against rule by an uninformed mob, as Purdue University social studies education professor Phillip J. VanFossen explains. He describes how electors came to cast the decisive votes for president, writing:

“(The) founders were reassured that with this compromise system, neither public ignorance nor outside influence would affect the choice of a nation’s leader. They believed that the electors would ensure that only a qualified person became president. And they thought the Electoral College would serve as a check on a public who might be easily misled, especially by foreign governments.”

The Committee on Postponed Questions
These 11 delegates to the Constitutional Convention in 1787 agreed on a compromise that created the Electoral College. The Conversation, from Wikimedia Commons, CC BY-ND

2. Creating new danger

By contrast, though, Barry C. Burden, a political science scholar at the University of Wisconsin-Madison, found that rather than protecting American democracy, the Electoral College system created a new risk:

Someone who wants to infiltrate the election system would have difficulty causing problems in a national popular vote because it is decided by thousands of disconnected local jurisdictions. In contrast, the Electoral College makes it convenient to sow mischief by only meddling in a few states widely seen as decisive.”

3. Protecting the popular vote?

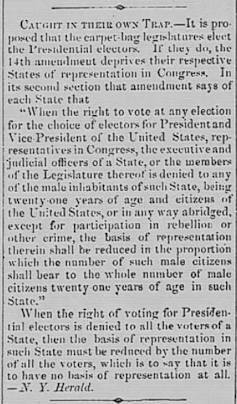
A news item published Aug. 19, 1868, in South Carolina provides insight about the contemporaneous understanding of Section 2 of the 14th Amendment. The Anderson Intelligencer via newspapers.com

There may be limits to that meddling, though. The Constitution allows state legislatures to choose the electors – which Donald Trump and his supporters tried to exploit in 2020 by asking Republican state legislators to appoint fake electors to confuse matters.

However, as Eric Eisner, a history Ph.D. student at Johns Hopkins University, and David B. Froomkin, a law professor at the University of Houston Law Center, explain, that would have run afoul not only of those states’ laws but also of another provision of the Constitution: The 14th Amendment says that if a state disenfranchises any of its voters, that state loses a proportional amount of its seats in the House of Representatives.

So, Eisner and Froomkin explain:

(I)f a state legislature were to directly choose electors, that would disenfranchise all of the state’s voters. The right to vote, after all, is the right to have one’s vote counted, not the right to have one’s preferred candidate win. If all of a state’s voters have their right to vote taken away, Section 2 requires that the state’s House representation immediately and automatically be reduced to zero.”

That, in turn, means the state would only have two electors – and would no longer be a factor in the election.

4. Why does the US still have an Electoral College?

Other nations took a lead from the U.S. creation of the Electoral College, creating their own versions. But they didn’t last, as Westminster College political scientist Joshua Holzer explained:

None have been satisfied with the results. And except for the U.S., all have found other ways to choose their leaders.”

Many people in the U.S. also have problems with the Electoral College, and Holzer identifies one effort underway to replace it without amending the Constitution. But even that wouldn’t ensure that the person who becomes president would be supported by at least half of the people who cast ballots.The Conversation

Jeff Inglis, Politics + Society Editor, The Conversation

This article is republished from The Conversation under a Creative Commons license. Read the original article.
Thursday, October 31, 2024

Independent voters think for themselves and stay out of politics – 3 essential reads

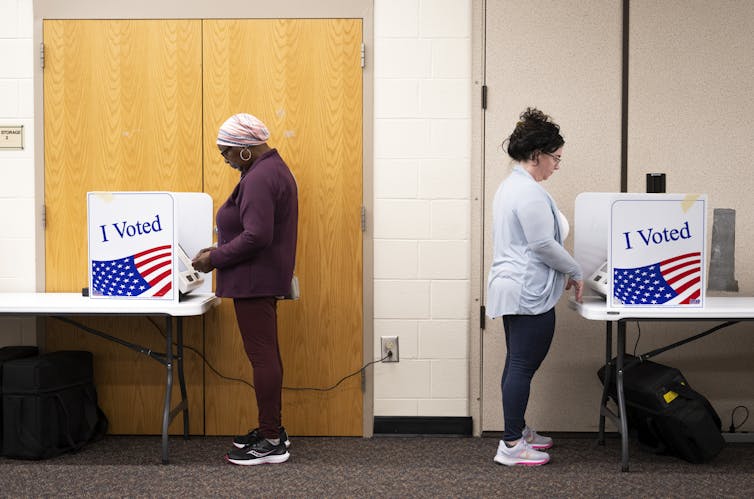
Jessie Harris, left, a registered independent voter in South Carolina, casts a ballot in February 2024. Joe Lamberti for The Washington Post via Getty Images
Jeff Inglis, The Conversation

In the 2024 election, the two major-party campaigns and many news reporters are spending a lot of time talking about independent voters – those who are neither aligned with the Republican Party nor the Democratic Party. Despite the power that political independents are anticipated to have over the election results, there’s a lot that remains unknown about this group.

The Conversation U.S. has published several articles about what is known, and why it’s hard to know much more. Here are selections from some of those articles:

1. How many independent voters are there?

It’s very hard to answer that question, wrote Thom Reilly, a professor of public affairs at Arizona State University. Part of the problem is figuring out how to define who independent voters are. Surveys often ask people if they are Republicans, Democrats or independents, and if they answer that they are independents, the surveys ask how strongly they might lean toward one party or the other. But this muddies the waters of political identity, Reilly wrote:

It’s possible that some voters identify as independent but really just have weaker political preferences than party die-hards, while still maintaining some loyalty to one party or the other. And some independent voters change their political identification from one cycle to another. That makes it hard to tell who an independent voter is and how many of them exist.”

Those changing alignments, Reilly wrote, “may require scholars, media outlets and the public to shift their traditional two-party view of American politics.”

2. Independent voters think for themselves

Independent voters exhibit a key quality that most Americans expect of their fellow citizens: They base their views on their life experiences.

Unfortunately, as politics scholars Shanna Pearson-Merkowitz at the University of Maryland and Joshua J. Dyck at UMass Lowell explained, this is an attribute almost unique to political independents:

In contrast, Democrats’ and Republicans’ ideas of what problems deserve government attention and how to solve them are much less likely to be based on their own life experiences, and instead simply mirror the information they have gained from leading political figures on social media, on cable news networks or through other partisan information outlets.”

For instance, independents living in neighborhoods with high levels of gun violence are far more likely to report being concerned about gun violence than independents who live in safer areas. But, Pearson-Merkowitz and Dyck wrote,

“for Democrats and Republicans, there is no relationship between where they live and their level of concern about gun violence: Whether they live in a relatively dangerous community or a relatively safe one, their views on gun violence reflect their party’s messages on the issue.”

3. Independents less likely to engage in any politics

Research into independents’ political activity finds them tending to stay away from politics, wrote Julio Borquez, a political science scholar at the University of Michigan-Dearborn:

“Perhaps most importantly, pure independent voters are simply less likely to vote than those who express any degree of partisan attachment. In the 2020 presidential election, reported turnout among pure independents was about 20 percentage points lower than turnout among other voters, including independents who lean toward a party.”

Research has found members of this group “tend to be genuinely put off by partisan conflict and party labels,” Borquez wrote. Different studies have found, for instance, that they prefer photos of neighborhoods that did not show political yard signs over the same photos of the same neighborhoods with homes displaying political yard signs. And they pay less attention to campaigns and partisan social media than people with partisan affiliations.

So they are indeed independent – but the question remains whether they will be uninvolved in 2024 or motivated to cast their ballots and make their views known.The Conversation

Jeff Inglis, Politics + Society Editor, The Conversation

This article is republished from The Conversation under a Creative Commons license. Read the original article.

Wednesday, October 30, 2024

Slow vote-counting, flip-flopping leads, careful certification and the weirdness of the Electoral College – people who research elections look at what to expect on election night

What should you make of the flood of information about the election? Dilok Klaisataporn/iStock / Getty Images Plus
Jeff Inglis, The Conversation

As Election Day arrives, people’s feelings of eagerness and anxiety can intensify. It’s normal to want to know the results, but it’s also important to make sure that when the results are announced, they’re accurate.

The Conversation U.S. has covered many aspects of the election, including the mechanics of tallying and reporting the votes. Here are selections from some of those articles:

1. How long did it take to count votes in 2020?

In 2020, Election Day was Nov. 3. While some results emerged that evening and over the subsequent days, it was not until four days later, Nov. 7, that The Associated Press called the race for Joe Biden over Donald Trump.

Waiting can be unsatisfying, wrote John M. Murphy, a communications scholar at the University of Illinois at Urbana-Champaign, but it’s key to getting accurate results.

Murphy warned: “People tend to see what they want to see. … Partisans want that beautiful picture of triumph, blue or red seas cascading across screens on election night.” But, he observed, that might be a mirage – and realizing it’s a mirage means one thing: “Wait. … Wait until we know it’s real.”

Election officials count ballots.
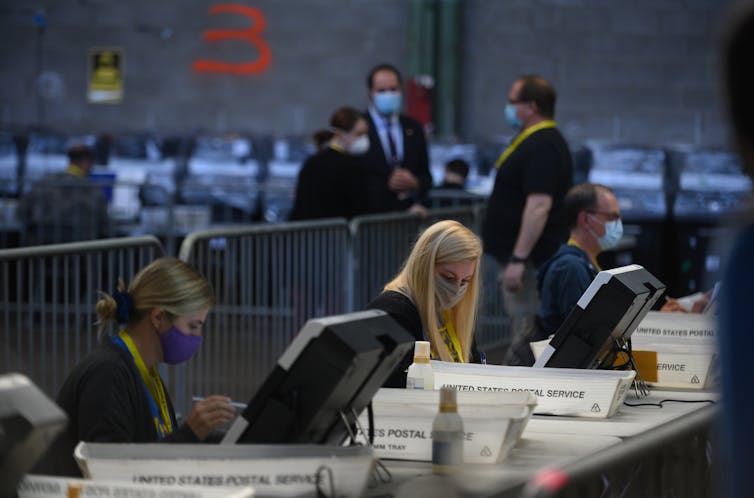
Election officials count ballots at the Allegheny County elections warehouse in Pittsburgh in 2020. Jeff Swensen/Getty Images

2. Why do candidates’ leads change as the results emerge?

Every state counts votes slightly differently. Some, like Colorado, allow election workers to begin counting absentee ballots in advance of Election Day, while in other states, like Illinois, the count can’t even start until the polling places close at the end of Election Day.

In addition, various communities report their results in different ways. Some may release preliminary results every so often while the counting continues, while others may wait until counting is fully complete before announcing any results.

That’s why vote counts change over time: Partial results are updated, and additional results are added to statewide tallies. In a 2020 article, Kristin Kanthak, a political science professor at the University of Pittsburgh, went through the whole process, including the release of partial results:

“Importantly … this doesn’t mean the system is ‘rigged.’ Actually, it means the system is transparent to a fault,” she wrote.

3. How do we know the results are accurate?

Election officials take their jobs very seriously and work hard to count all the eligible votes accurately while under great pressure. They have specific rules and processes for how to handle ballots and vote-counting.

Derek Muller, an election-law scholar at the University of Notre Dame, explained those steps in detail, highlighting the focus on verifiable facts rather than people’s opinions about the process:

Certifying an election is a rather mundane task. … It is little more than making sure all precincts have reported and the arithmetic is correct. But it is an important task, because it is the formal process that determines who won the most votes.”

People sit at tables opening envelopes.
Washoe County employees in Nevada open ballots as they begin processing mailed ballots in the 2024 primary election. AP Photo/Andy Barron

4. Who invented the Electoral College?

Of course, the candidate who gets the most votes doesn’t necessarily win the presidency. The official decision is made by the Electoral College.

Phillip VanFossen, a civics educator at Purdue University, explained that the Constitutional Convention in the summer of 1787 came up with three ideas, but couldn’t agree. Determined to find common ground, even if it was imperfect, the delegates told 11 men to come up with a solution, which was the Electoral College.

VanFossen explained that “with this compromise system, neither public ignorance nor outside influence would affect the choice of a nation’s leader. (The delegates) believed that the electors would ensure that only a qualified person became president. And they thought the Electoral College would serve as a check on a public who might be easily misled, especially by foreign governments.”

5. Why does the US still have an Electoral College?

Other nations were inspired by the U.S. Constitution, but not for long, as Westminster College political scientist Joshua Holzer explained:

None have been satisfied with the results. And except for the U.S., all have found other ways to choose their leaders.”

Many people in the U.S. also aren’t satisfied with the Electoral College, and Holzer identifies one effort under way to replace it without amending the Constitution. But even that won’t ensure that the person who becomes president is supported by at least half of the people who cast ballots.The Conversation

Jeff Inglis, Politics + Society Editor, The Conversation

This article is republished from The Conversation under a Creative Commons license. Read the original article.

Monday, July 1, 2024

Supreme Court rules that Trump had partial immunity as president, but not for unofficial acts − 4 essential reads


President Donald Trump speaks at a rally on Jan. 6, 2021, before the Capitol insurrection. Mande Ngan/AFP via Getty Images
Amy Lieberman, The Conversation; Jeff Inglis, The Conversation, and Naomi Schalit, The Conversation

The U.S. Supreme Court has ruled that a president, including former President Donald Trump, “may not be prosecuted for exercising his core constitutional powers, and he is entitled, at a minimum, to a presumptive immunity from prosecution for all his official acts.”

The decision is “super nuanced,” as a law scholar explained to The Conversation shortly after the decision was announced on July 1, 2024.

While a president has total immunity for exercising “core constitutional powers,” a sitting or former president also has “presumptive immunity” for all official acts. That immunity, wrote Chief Justice John Roberts in the majority opinion, “extends to the outer perimeter of the President’s official responsibilities, covering actions so long as they are not manifestly or palpably beyond his authority.”

“There is no immunity for unofficial acts,” the court ruled.

The vote was 6-3, as the court’s three liberal justices – Elena Kagan, Sonia Sotomayor and Ketanji Brown Jackson – strongly disagreed with the majority opinion in a dissent.

“Today’s decision to grant former Presidents criminal immunity reshapes the institution of the Presidency. It makes a mockery of the principle, foundational to our Constitution and system of Government, that no man is above the law,” Sotomayor wrote in the dissenting opinion.

The federal prosecution against Trump for his actions to overturn the 2020 presidential election will now go back to lower courts to determine which of the federal charges against Trump can proceed. One outcome, though, is clear – this decision will have a major impact on presidential power and the separation of powers in government.

Until all of the decision’s nuances are parsed by constitutional law scholars, here are four stories to help readers better understand the arguments leading up to the decision and what was at stake with this case.

People stand outside the Supreme Court and hold signs, one of which that says, 'Trump is not above the law'
People protest outside the Supreme Court on July 1, 2024, ahead of the court’s anticipated decision on whether Donald Trump is immune from prosecution. Drew Angerer/AFP via Getty Images

1. Laying the groundwork

Trump claimed he is immune from federal prosecution for his efforts to overturn the 2020 presidential election because he was in office as president at the time.

Trump’s argument centered on a claim … that a president cannot be subjected to legal action for official conduct or actions taken as part of the job,” wrote Claire B. Wofford, a political science scholar at the College of Charleston.

Since 1982, in a case dating back to Richard Nixon’s presidency, presidents have been deemed immune from civil lawsuits based on their officials acts, Wofford explained, and Trump sought to expand that immunity protection. But it was a big ask, Wofford wrote:

“Protecting the president from the hassles of civil litigation is one thing; permitting the president, charged in Article 2 of the Constitution with faithful execution of the laws, to be able to break those same laws with impunity is quite another.”

Indeed, U.S. District Court Judge Tanya Chutkan wrote in December 2023 that Trump did not have the “divine right of kings to evade criminal accountability.” And a federal appeals court agreed in February 2024. That’s the ruling Trump appealed to the Supreme Court.

2. An inconsistent claim

Trump’s claim faced an uphill battle. Stefanie Lindquist, a scholar of constitutional law at Arizona State University, observed:

In several of the lawsuits he filed challenging election results in the wake of the 2020 election, Trump himself said he was acting ‘in his personal capacity as a candidate,’ as distinct from his official capacity as president.

"Now, though, Trump claims that whether or not he was acting as a candidate on Jan. 6, his comments on ‘matters of public concern’ fall within the scope of his presidential duties.”

That inconsistency, as well as the general principle in the Constitution that no person could be above the law, made Trump’s position a difficult one to argue.

3. A decision a long time coming

Wofford, a constitutional law scholar at the College of Charleston, observed before the Supreme Court’s July ruling that there was public concern about the time it took the court to reach a decision, but she said that delay was much more likely in service of democracy than it was a partisan play:

When the Supreme Court makes a decision, it is inevitably answering a very difficult legal question. If the answers were clear, the case never would have been the subject of high court litigation in the first place.”

And the task the justices have in deciding the case is vital to the nation, she wrote:

“(G)iven the potentially unconstitutional actions Trump has threatened to take if re-elected, the country will need a strong and well-respected Supreme Court in the very near future. Those angry with the court should actually be very glad it is working as usual here. If it weren’t, their fear that Trump will get away with it all may indeed be realized.”

Two men talking in a room behind a chandelier.
Donald Trump speaks after the appeals court hearing on his claim of immunity from prosecution on Jan. 9, 2024, in Washington. Jabin Botsford/The Washington Post via Getty Images

4. What this means for the future

Earlier this spring, Wofford noted some disturbing portents during the oral arguments before the Supreme Court on April 25, 2024:

Several of the justices, across the ideological spectrum, were very concerned about the practical implications of allowing a president to have immunity to some extent, or not allowing the president to have immunity.”

For instance, Wofford noted,

“Justice Samuel Alito seemed really concerned about the president being subject to political prosecution if he were not protected by immunity. … On the flip side … (Justice Ketanji Brown Jackson) said a president could enter office ‘knowing that there would be no potential penalty for committing crimes.’”

Wofford expected the justices would try to avoid granting either complete immunity or no immunity at all – and therefore allow Trump’s federal trial for attempting to overturn the 2020 presidential election to continue based on the fact that many of his actions were private, not official. Though that held peril, too, Wofford wrote:

“I wish there were a different vehicle through which the court could resolve this question and that it didn’t feel to so many people that the fate of our government, and the stability of our system, was on the line. … If it does not make a clear, resounding statement that the president is not above the law, then I think we have a serious problem.”

This story is a roundup of articles from The Conversation’s archives.The Conversation

Amy Lieberman, Politics + Society Editor, The Conversation; Jeff Inglis, Politics + Society Editor, The Conversation, and Naomi Schalit, Senior Editor, Politics + Democracy, The Conversation

This article is republished from The Conversation under a Creative Commons license. Read the original article.
Thursday, May 9, 2024

These U.S. cities have the best public transit (2024 study)

 Published on ConsumerAffairs.com

One factor people consider when looking for a new home is how easy it is to get around. Driving and walking are the most common modes of transportation, but prospective buyers and renters are also increasingly considering public transportation.

In 2018, only 30% of buyers said a new home’s proximity to public transit was “very important” or “extremely important,” according to the 2023 Zillow Consumer Housing Trends Report. But in 2023, 43% said so — the largest increase of any neighborhood characteristic. Thirty-seven percent of renters said living near public transportation was “very important” or “extremely important,” the highest level in the past six years. While many people may want to be close to public transit for career purposes, the benefits may extend beyond work.

“Living near public transportation is more important to today’s buyers and renters than it’s been in at least the past several years. Still, it’s likely not the deciding factor for many movers — more say living in a walkable neighborhood, living near leisure amenities and living near family are important to them,” Zillow senior economist Nicole Bachaud told ConsumerAffairs.

 “While the importance of living near public transportation has been on an upswing for homebuyers, the importance of commute times has stayed relatively steady. That could indicate buyers are interested in public transit for more than just their trips to the office and back.”

Knowing how you'll get around your new hometown is vital before hiring movers to take you there. To help, the ConsumerAffairs Research Team investigated and ranked the nation’s 50 largest cities to see which have the best public transit systems. The analysis is based on 2022 data from the U.S. Department of Transportation’s National Transit Database, and it takes into account how useful, safe, affordable and efficient transit services are in the nation’s top cities.


KEY INSIGHTS

Bigger isn’t always better. While the country’s most populous metro area, New York City, had the highest-scoring transit system, second place went to the much smaller San Francisco metro area. Only three of the top 10 transit systems are in the nation’s top 10 most populous cities.

Good transit spans the country. Among large cities, the top 20 for transit include locations on the Atlantic and Pacific Coasts, the South, the Mountain West, the Midwest and along the Great Lakes.


Transit is safe. The average rate of major safety events across the 50 largest U.S. cities’ transit systems is 3 per 1 million miles traveled by transit vehicles.


Transit is affordable. The average transit trip in the nation’s largest cities costs $2.56 one way, even when accounting for varying prices by distance, peak hours and monthly passes.


Top 10 cities with the best public transit

Some advantages of public transit systems include their eco-friendliness, shorter commute times and connectability. Transit vehicles emit far fewer greenhouse gases per passenger mile than a regular car, and you don’t have to fight traffic yourself or pay for parking at your destination. Transit lines also usually connect, making longer trips possible, such as weekend getaways.

Personal advantages abound, too. Riding on local public transit can allow you to see diverse neighborhoods and meet other people you share the city with. Relieved from driving, you can also rest, read or otherwise relax during the journey.

Artificial intelligence can also make public transit systems more efficient and save riders time by analyzing different routes and schedules to get you to your destination faster and without as much of a hassle.

A 2020 report from the International Association of Public Transport found AI offers the potential to adjust transit services in real time, responding to heavy traffic, heavy ridership and sudden emergencies. The report found that AI systems can also help users plan journeys that combine multiple stops and interconnecting services and adapt fares to meet specific goals for both revenue and equity. They can also save agencies money by optimizing fuel efficiency and maintenance services.

Since that report came out, the U.S. federal government has spent millions of dollars helping transit agencies around the country develop AI systems that aim to improve service, reliability and cost in transit systems. The starting point for many of the nation’s most populous cities is already quite good — but there is still much room for improvement everywhere.

Here’s how the cities stacked up:

1. New York, New York

  • Annual public transit trips per metro area resident: 144.2
  • Share of stations ADA-compliant: 51.4%
  • Safety score (combining fatalities and serious injuries): 13.07 out of 20
  • Average fare revenue per trip: $1.75

The nation’s most populous metro area is served by a large number of transit agencies, with trains and buses covering the five boroughs of New York City itself, as well as areas well into New Jersey, Connecticut and downstate New York. While the average fare revenue is higher than most, it’s still cheaper per trip than in Pittsburgh, Pennsylvania, and Buffalo, New York.

2. San Francisco, California

  • Annual public transit trips per metro area resident: 53.6
  • Share of stations ADA-compliant: 97%
  • Safety score (combining fatalities and serious injuries): 13.91 out of 20
  • Average fare revenue per one-way trip: $1.63

With the third-worst commuter traffic in the nation, San Francisco residents might be desperate for other ways to get around. Fortunately, Bay Area Rapid Transit connects the city with its suburbs, and the Muni bus and train system – including the city’s famous cable cars – gets people around the city itself. There are also free shuttles to get people to and from public parks.

3. Los Angeles, California

  • Annual public transit trips per metro area resident: 29
  • Share of stations ADA-compliant: 100%
  • Safety score (combining fatalities and serious injuries): 16.48 out of 20
  • Average fare revenue per one-way trip: 49 cents

Los Angeles, well known as a sprawling car-oriented metropolis, has a transit system that doesn’t get as much use per capita as other cities’ services. However, it’s one of the safest and most affordable transit systems nationwide.

4. Richmond, Virginia

  • Annual public transit trips per metro area resident: 8.5
  • Share of stations ADA-compliant: 100%
  • Safety score (combining fatalities and serious injuries): 18.27 out of 20
  • Average fare revenue per one-way trip: 24 cents

With free local bus fares across the city, including high-speed buses with some dedicated lanes that provide service every 10 minutes on weekdays and every 15 minutes on weekends, Richmond’s public transit system is safer and more efficient than many other large cities’ services. Unfortunately, it is used less frequently than any other system mentioned in our top 10 list.

5. San Diego, California

  • Annual public transit trips per metro area resident: 21
  • Share of stations ADA-compliant: 100%
  • Safety score (combining fatalities and serious injuries): 14.74 out of 20
  • Average fare revenue per one-way trip: $1.10

new safety initiative, expanded service and upcoming investments in new vehicles, including electric buses, are drawing riders to San Diego’s trolleys and buses, which serve the downtown area and the surrounding communities.

6. San Antonio, Texas

  • Annual public transit trips per metro area resident: 12.6
  • Share of stations ADA-compliant: 100%
  • Safety score (combining fatalities and serious injuries): 18.44 out of 20
  • Average fare revenue per one-way trip: 58 cents

San Antonio’s bus service spans the city and is set to expand in the coming years. The agency that runs it, VIA Metropolitan Transit, is also working to make its service schedules and maps more comprehensible to prospective users. The city is also considering new zoning rules that would make denser housing along high-capacity bus lines easier for developers to build.

7. Boston, Massachusetts

  • Annual public transit trips per metro area resident: 47.5
  • Share of stations ADA-compliant: 78%
  • Safety score (combining fatalities and serious injuries): 14.57 out of 20
  • Average fare revenue per one-way trip: $1.63

In Boston, a city well known for confounding even local drivers with one-way streets and hairpin turns, it’s tempting to let someone else handle navigation. Even with a relatively expensive average fare and incomplete ADA compliance at stations, the city’s MBTA trains and buses are relied on more heavily than transit vehicles in other large cities.

8. Seattle, Washington

  • Annual public transit trips per metro area resident: 36.7
  • Share of stations ADA-compliant: 99.1%
  • Safety score (combining fatalities and serious injuries): 14.52 out of 20
  • Average fare revenue per one-way trip: $1.57

Seattle’s public transit system, which includes buses, trains, and ferries, links its suburbs, downtown area and nearby islands. In 2024, the city is asking voters to raise their taxes to pay for a 20-year transportation plan that includes pothole repair and expanded transit services.

9. Washington, D.C.

  • Annual public transit trips per metro area resident: 36.7
  • Share of stations ADA-compliant: 100%
  • Safety score (combining fatalities and serious injuries): 15.41 out of 20
  • Average fare revenue per one-way trip: $1.29

The D.C. area’s roads are so famously congested that people joke there is no rush hour at all — except all the time. Fortunately, the Metro system encompasses trains, buses and subways run by city officials and state and local agencies in neighboring Maryland and Virginia.

10. Salt Lake City, Utah

  • Annual public transit trips per metro area resident: 26.7
  • Share of stations ADA-compliant: 100%
  • Safety score (combining fatalities and serious injuries): 11.83 out of 20
  • Average fare revenue per one-way trip: $1.07

Bus and rail lines crisscross the city and the surrounding county. The city’s plans for transit expansion call for additional services by 2030 and are being used to tempt Olympic officials to consider it as a location for the 2034 Winter Games.

U.S. public transit systems, ranked

In this study, we examined a range of data points from the U.S. Department of Transportation’s National Transit Database and calculated a score for each city, with a maximum number of 100 points achievable. You can read the full methodology below.


Why you should consider moving to a city with a good public transit system

When you’re looking for your next place to live — whether near where you already call home or somewhere farther afield — it’s worth noting how close transit services are and how well they’ll get you where you want to go.

According to Nicholas Julian, the senior program manager for land use at the National Association of Home Builders, builders and developers are noticing this interest. He observed that the move toward “transit-oriented development” has been decades in the making, with governments and private companies working to build housing along existing transit routes to reduce traffic and pollution. 

He noted that many cities are also rethinking minimum parking requirements to reflect residents’ desire to drive less and discourage additional cars from clogging the roads.

Although Julian works most directly with people involved in suburban development projects not designed explicitly around transit, he notes that “any type of access to public transit ...  will be advertised” to prospective buyers or renters.

He pointed out that some developers are stepping forward to reduce driving while improving people’s ability to get the services and experiences they want. For example, Culdesac Tempe, in Arizona, is a development that actively discourages residents from owning cars while providing free transit, reduced ride-sharing costs and free e-bikes to at least some residents.

“If you can build a car-free community in Tempe, it’s probably possible just about anywhere,” Julian said. That may also mean you can live a car-free or car-light lifestyle in just about any other city, too.

Methodology

The ConsumerAffairs Research Team conducted a comprehensive analysis of the public transit systems in the 50 most populous metropolitan areas across the United States and scored each on a point scale from zero to 100. To determine which cities had the best public transportation, we looked at the following metrics:

  • Usefulness to riders: We defined how useful a transit system was to its city’s residents based on three factors:
    • First, we calculated how many independent passenger trips the population took in 2022 in relation to the metro area’s population. This information was based on the National Transit Database annual metrics for 2022. (25 possible points)
    • Second, we calculated how far passengers traveled in 2022 per resident in the metro area. (20 possible points)
    • Third, we looked at how easy the main public transit system was to access for people with physical disabilities. We used the 2022 National Transit Database information on transit stations to calculate the percentage of all ADA-compliant systems. (10 possible points)
  • Safety: Based on the National Transit Database’s Safety & Security Major Event Time Series data for 2022, we calculated the number of major events, including collisions and derailments, per vehicle revenue mile in 2022. (10 possible points)
    • We also calculated the rate of fatalities and injuries in major events per 2022 vehicle revenue mile. (5 possible points each)
  • Affordability: We looked at the fare revenue per unlinked passenger trip based on the National Transit Database annual metrics for 2022. We compared that with the median household income in 2022 for that metro area according to the U.S. Census Bureau’s American Community Survey. (15 possible points)
  • Efficiency: We determined the average operating cost per passenger mile based on the National Transit Database annual metrics for 2022. (10 possible points)

ConsumerAffairs writers primarily rely on government data, industry experts and original research from other reputable publications to inform their work. Specific sources for this article include:

  1. U.S. Census Bureau, “Total Population.” Accessed April 30, 2024.
  2. U.S. Department of Transportation, “National Transit Database 2022 Metrics.” Accessed April 30, 2024.
  3. U.S. Department of Transportation, “National Transit Database 2022 Annual Database Transit Stations.” Accessed April 30, 2024.
  4. U.S. Department of Transportation, “National Transit Database Safety & Security Major Event Time Series.” Accessed April 30, 2024.
  5. U.S. Census Bureau, “American Community Survey.” Accessed April 30, 2024.